
'Animating' the Line Graph
One of the things I struggle with when giving a presentation is keeping people engaged. Recently, I have found myself thinking through some creative ways of using visual imagery to engage the audience…

Missions Matter for Measuring Impact
A mission statement is so much more than a declaration of an organization’s purpose. In this post, I demonstrate how to go from mission to measurement of impact in three key steps…

The Levels of Conceptualization & Operationalization
Measurement is a broad subject area that spans many fields (e.g., education, psychology). Conceptualization and operationalization are integral to the measurement process…

On the Benefits of a Data Plan
A data plan is an integral part of a research grant or proposal. This post outlines a 5-STEP process for developing a data plan...
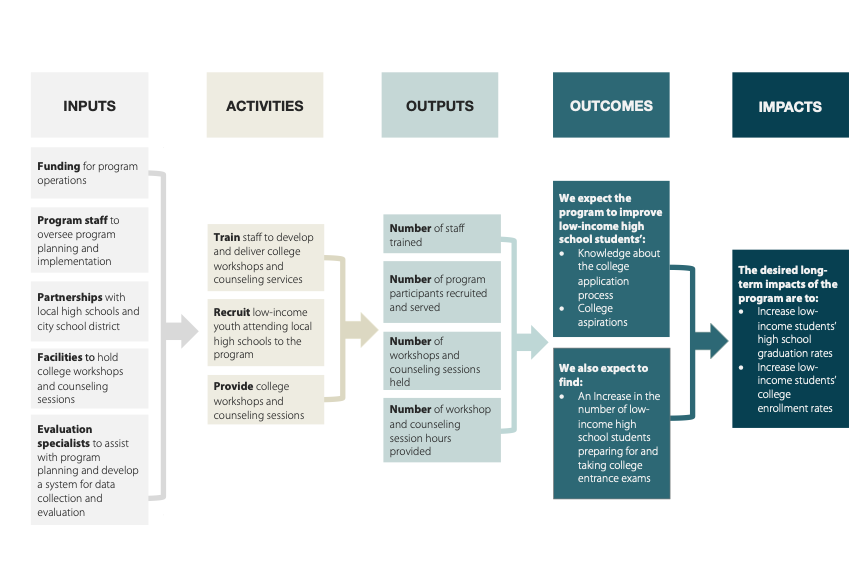
Leveraging the Program Logic Model
A logic model is a visual tool that illustrates how your program works and can be used to demonstrate to funders why they should invest in your program...
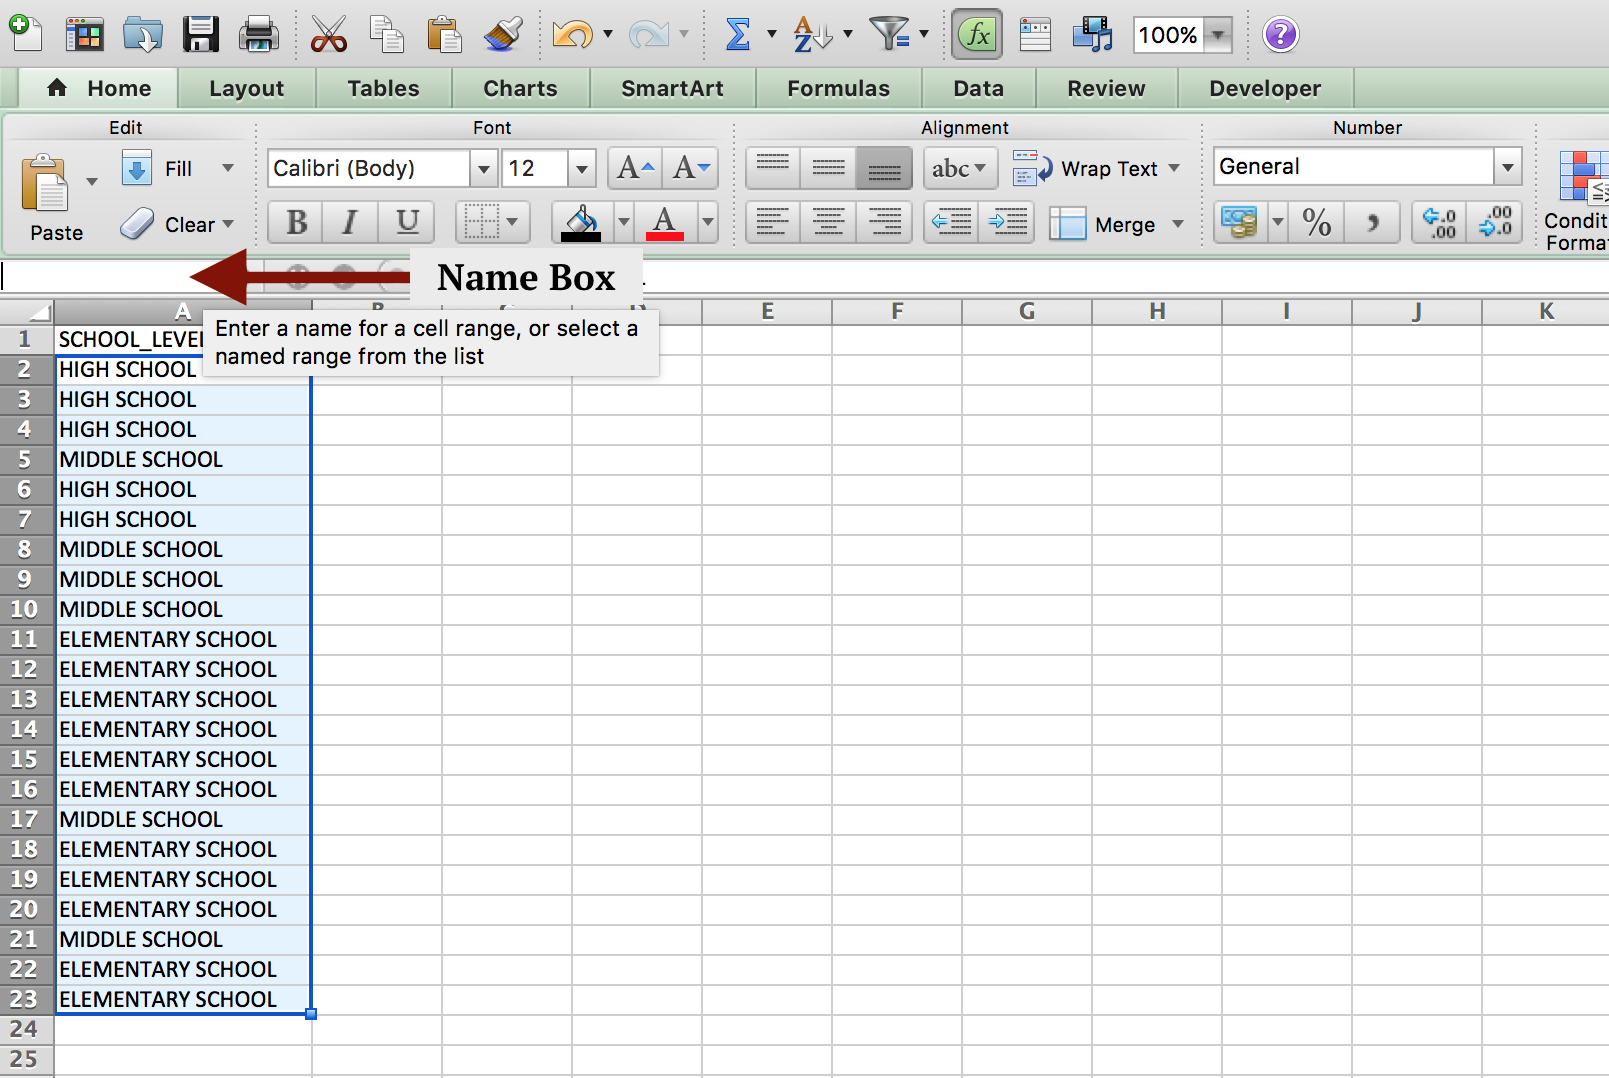
Simplify Excel Formulas Using Named Ranges
A named range is a feature in Excel that allows you to easily reference individual cells or groups of cells within a workbook using a descriptive name…