

About Analytics Made Accessible
Transform your data into actionable insights through meaningful analysis and story-driven visualizations. Analytics Made Accessible provides consultations and training designed to help people communicate their data more effectively.
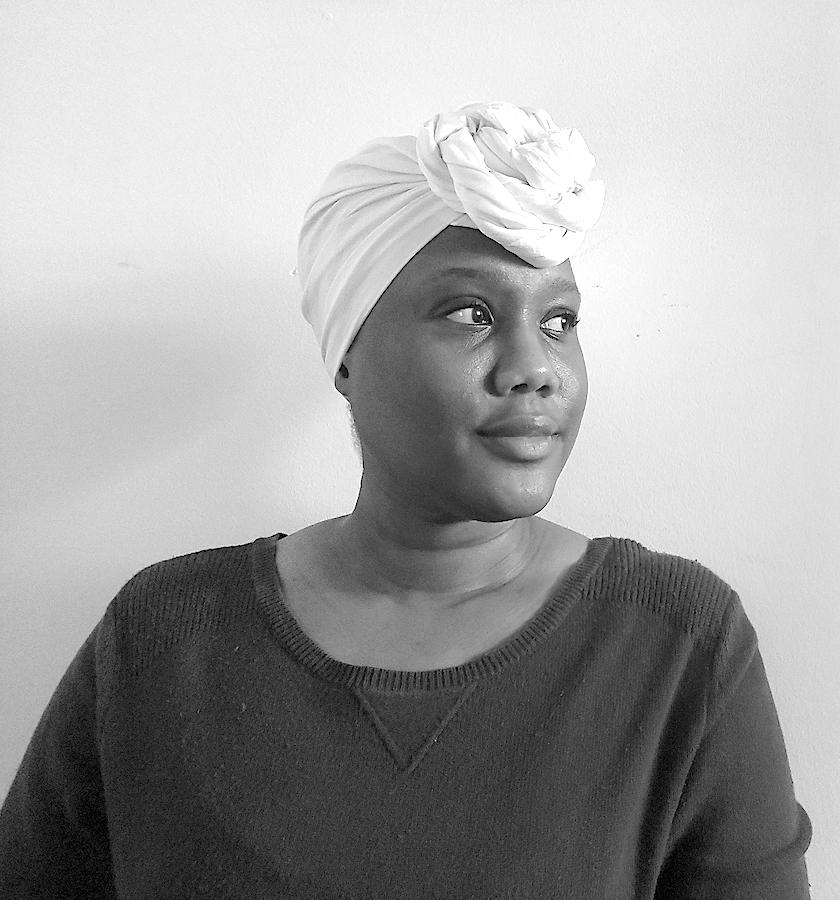
Meet Our Founder
Ama Nyame-Mensah is a data storyteller, social scientist, and founder of Analytics Made Accessible. She helps clients transform their data into actionable, story-driven insights through meaningful analysis and effective data visualization. When not working with clients, she blogs about data presentation, teaches folks to tinker with programming languages, and empowers people to use data for social analysis.
-
Critiquing Data Visualizations: An Interactive Panel Session. (Invited Panel for Modal Learning with Steve Wexler).
Becoming a Data Professional. (Guest Speaker at the Philadelphia Education Fund’s Scholars Advantage program; Slides)
From Clutter to Clarity: 8 Strategies for Telling Better Data Stories. (Webinar for the Association of Maternal & Child Health Programs; Handout)
From Clutter to Clarity: 8 Tips for Better Data Storytelling. (Invited Keynote for Modal Learning)
Beyond the Bar: Alternative Methods for Visualizing Change Between Two Data Points. (Invited Talk for the 2022-23 Evaluation Café Series, The Evaluation Center at Western Michigan University; Slides, Talk)
Data & Discrimination. (Interview with Dr. Gertrude Nonterah for The Bold Ph.D.; YouTube Video)
Can Quantitative Methods Answer Critical Questions? (Invited Guest Lecture at the American University, Quantitative Research in Education course; Slides)
From learn-R to teach-R: An expert panel on effective R instruction. (Invited panel for R-Ladies Philly; Slides)
Introduction to Item Response Theory. (Invited Guest Lecture at the University of Pennsylvania, Ph.D. program in Social Welfare Advanced Research Methods course; Slides)
Data for Social Impact: Challenges & Opportunities. (Invited panel for the University of Pennsylvania, Nonprofit Leadership program)
-
Research Associate
University of Pennsylvania, Graduate School of Education, Penn Child Research Center, & The Penn Futures Project, Sep. 2019 - Dec. 2021
Postdoctoral Fellow
University of Pennsylvania, School of Social Policy & Practice, Aug. 2020 - Aug. 2021
Research Scientist
Institute in Critical Quantitative, Computational, and Mixed Methods (ICQCM), Jan. 2020 - Aug. 2021
Postdoctoral Fellow & Lecturer
University of Pennsylvania, School of Social Policy & Practice, Aug. 2019 - May 2020
-
University of Pennsylvania
Ph.D. Social Welfare, 2019
University of Delaware
M.A. Urban Affairs & Public Policy, 2013
B.A. Economics, 2011
What are Clients Saying?